Vraag de kaart: a map of the Netherlands with an AI assistant and an MCP server
We built Vraag de kaart (“ask the map”), a map of the Netherlands with an AI assistant next to it. You ask something in Dutch and the assistant operates the map for you. It gets its facts from open government data and tells you where each one comes from.
This post is about the AI side of it: the chat that drives the map, the MCP server, and how we test the whole thing against the real model.
A 30 second clip of the real app, with Dutch voice-over:
The Domtoren in Utrecht in 3D, a plan area in Deventer, a new home and its shadow, and the start of a planning document. More videos on vraagdekaart.nl/video.
What it does
If you prepare a building plan in the Netherlands, almost everything you need to know is open data. It’s just spread over a lot of different viewers: parcels at the Kadaster, heights in the AHN, rules in the Omgevingsloket, and so on. Each one has its own interface.
Vraag de kaart puts it all on one map, with the chat on the left and the map on the right. It’s built for landscape architects first, and also for urban planners, planning consultants, architects and municipalities.
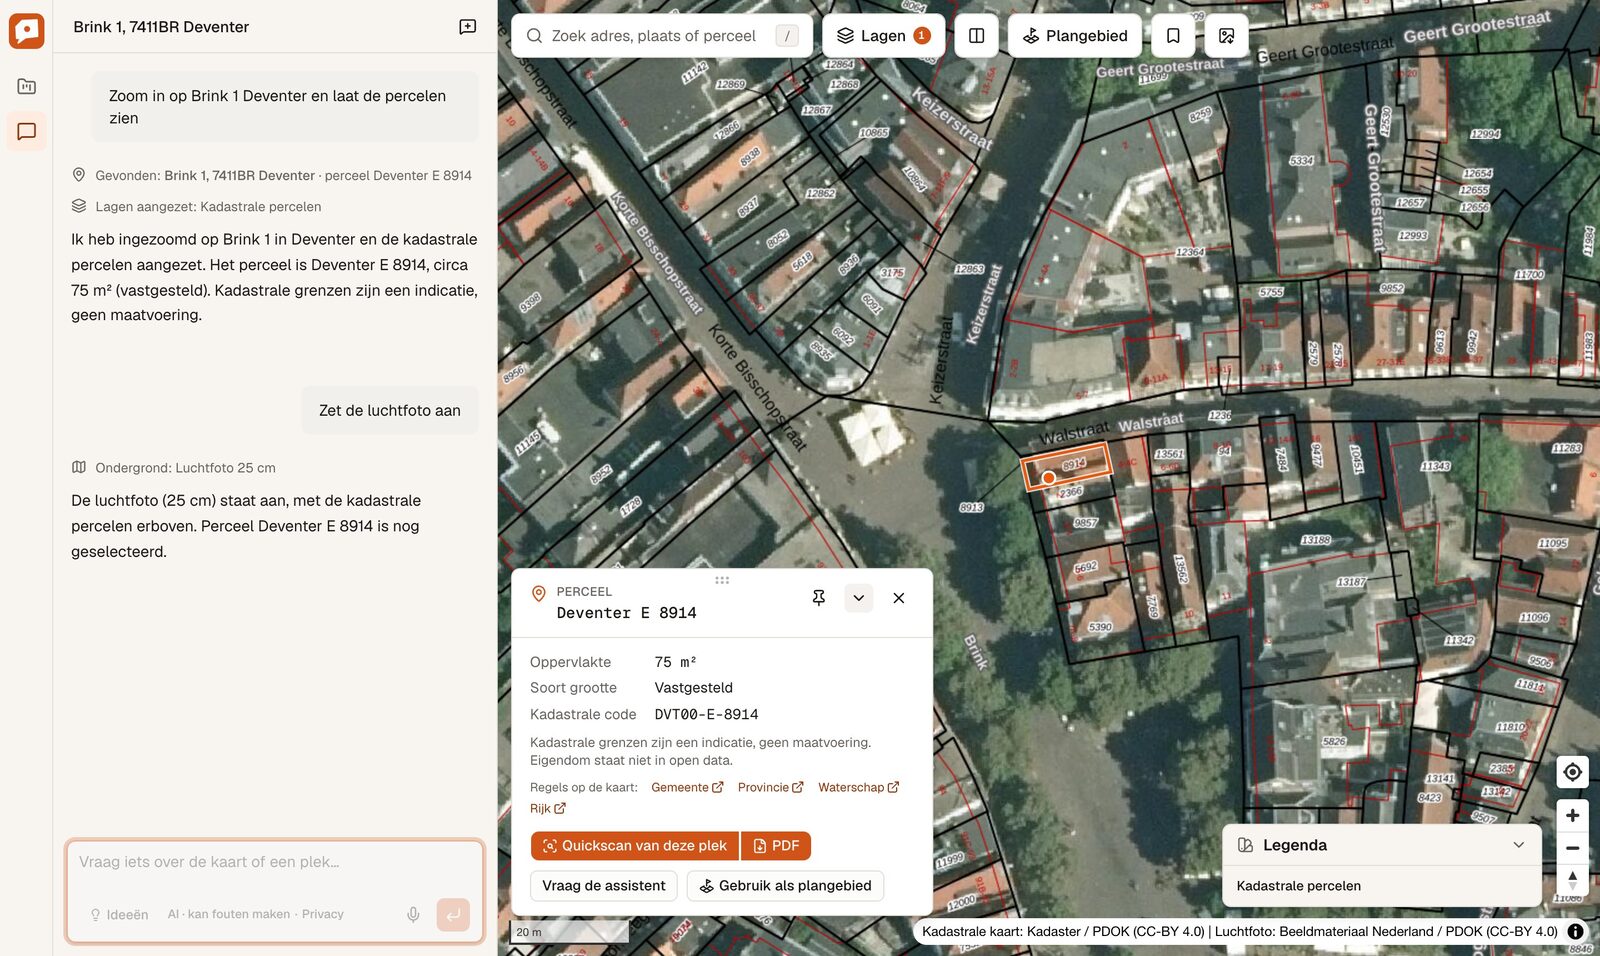
Here the question was to zoom in on Brink 1 in Deventer and show the parcels, followed by “turn on the aerial photo”. It found the address, turned on the cadastral layer, selected the parcel and switched the base map. The parcel card shows the area and the cadastral code, with links to the rules of the municipality, the province, the water board and the national government.
The assistant drives the map
The assistant has 32 tools, like searchLocation, flyTo, setLayers, setView3d, compareMaps, drawOnMap, findBuildings and showShadow. Every tool call shows up as a small line in the chat, so you can follow what it did.
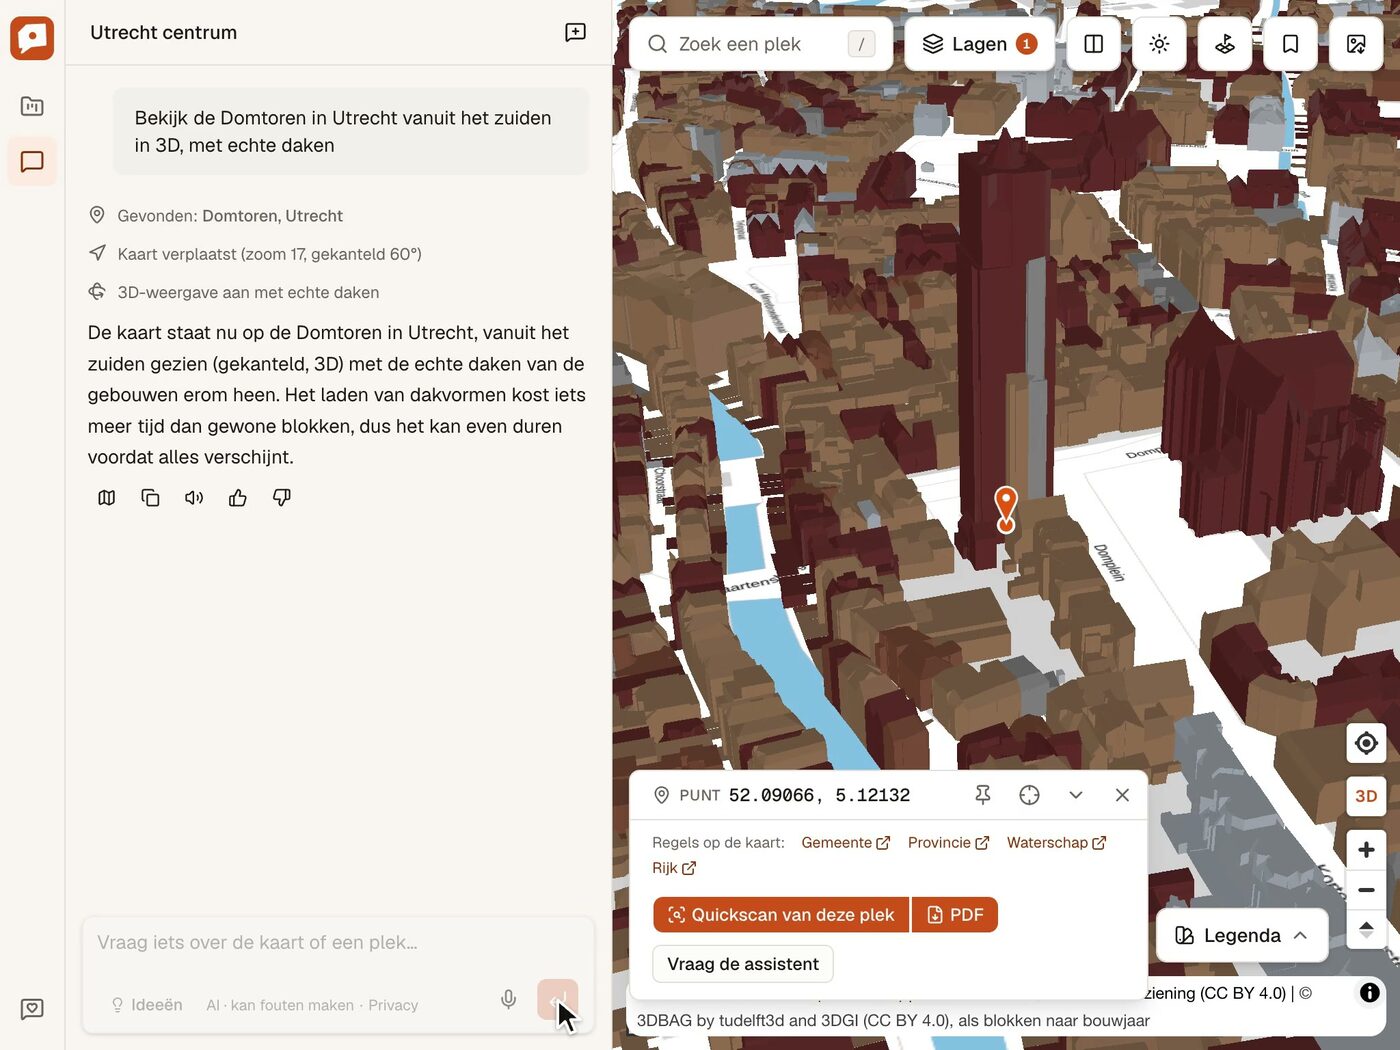
Ask for the Domtoren in 3D with real roofs and you first get three of those lines (found the Domtoren, moved the map to zoom 17 and tilted it 60°, turned on 3D with real roofs) and then the answer.
The map tools run in the browser. The server streams the model’s answer with the AI SDK, but the map tools have no server-side execute. When the model calls one, the browser runs it on your map, sends the result back and the conversation continues by itself. Trimmed from our code:
onToolCall: async ({ toolCall }) => {
  if (toolCall.dynamic || !isClientTool(toolCall.toolName)) return; // server or MCP tools
  const controller = getController();
  await controller.whenReady();
  const output = await runTool(toolCall.toolName, toolCall.input, { store, controller, bookmarks, downloads });
  void chat.addToolOutput({ tool: toolCall.toolName, toolCallId: toolCall.toolCallId, output });
},
sendAutomaticallyWhen: lastAssistantMessageIsCompleteWithToolCalls,
All map state lives in one zustand store, and one controller owns the MapLibre map. A click in the layer panel and a tool call from the model go through the same code, so the chat and the screen always agree on what’s shown.
You can also talk to it. The microphone button does dictation and answers can be read aloud, which is handy on a phone when you’re standing on the site.
Finding your way through 125 layers
The more we added to the map, the harder it got to find things. Most people will never open the groundwater layer, the cadastral map of 1832 or the year slider for old topographic maps, because they don’t know those exist. With the chat you don’t need to know. You ask your question and the assistant picks the layer.
For that to work the assistant has to know the map as well as the code does. Every layer is one entry in a registry, with its source, licence, the zoom level where the service starts drawing, an optional point query and a description written for the model. That same array feeds the map, the layer panel, the tool schemas and the system instructions. So when we add a layer, the assistant knows about it in the same commit.
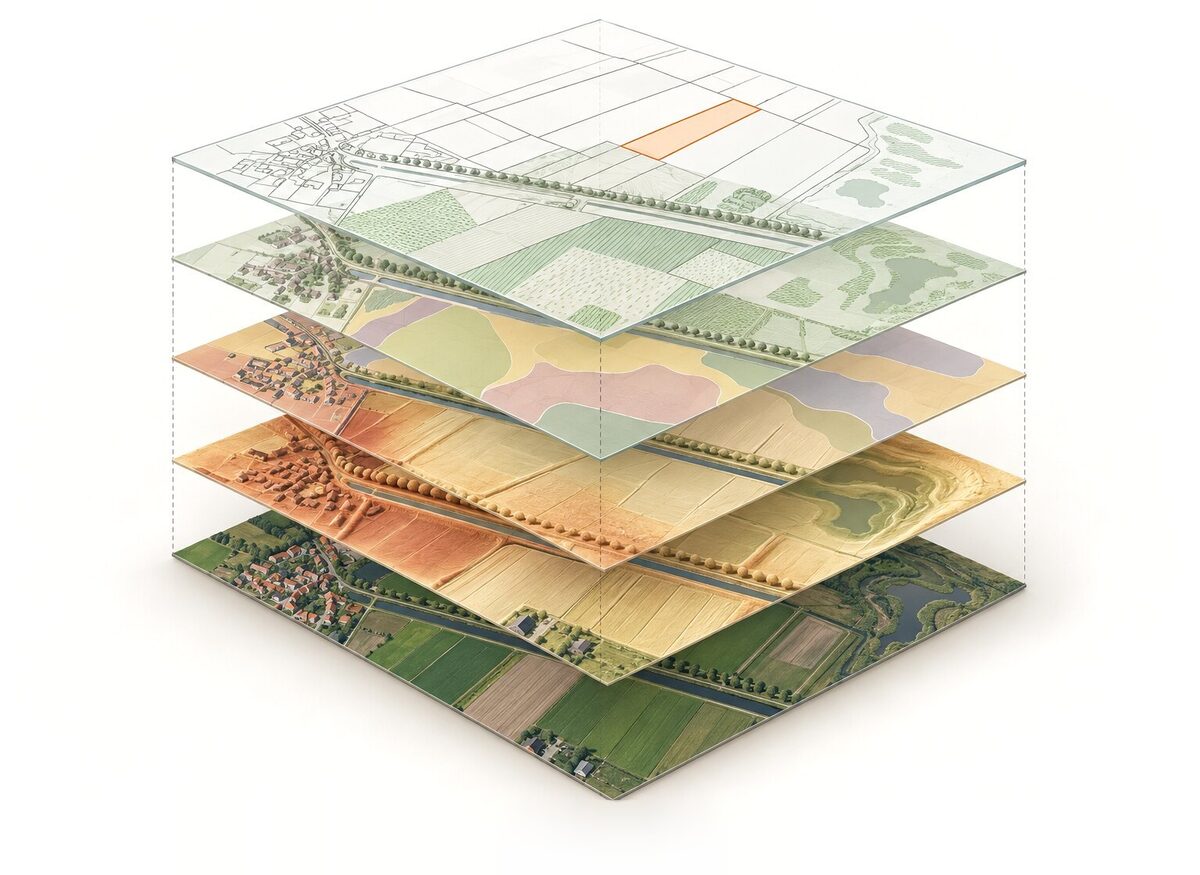
Tools work the same way. A tool is a schema, a browser implementation and a line in the chat, and the TypeScript compiler won’t build if one of the three is missing.
In practice you can ask how a place looked around 1900, and it switches to the Kadaster’s Tijdreis, which has a topographic map for every year since 1815. Ask it to compare 1950 with today and you get two maps side by side that move together. Or ask how far the shadow of a new home reaches on 21 March at three in the afternoon.
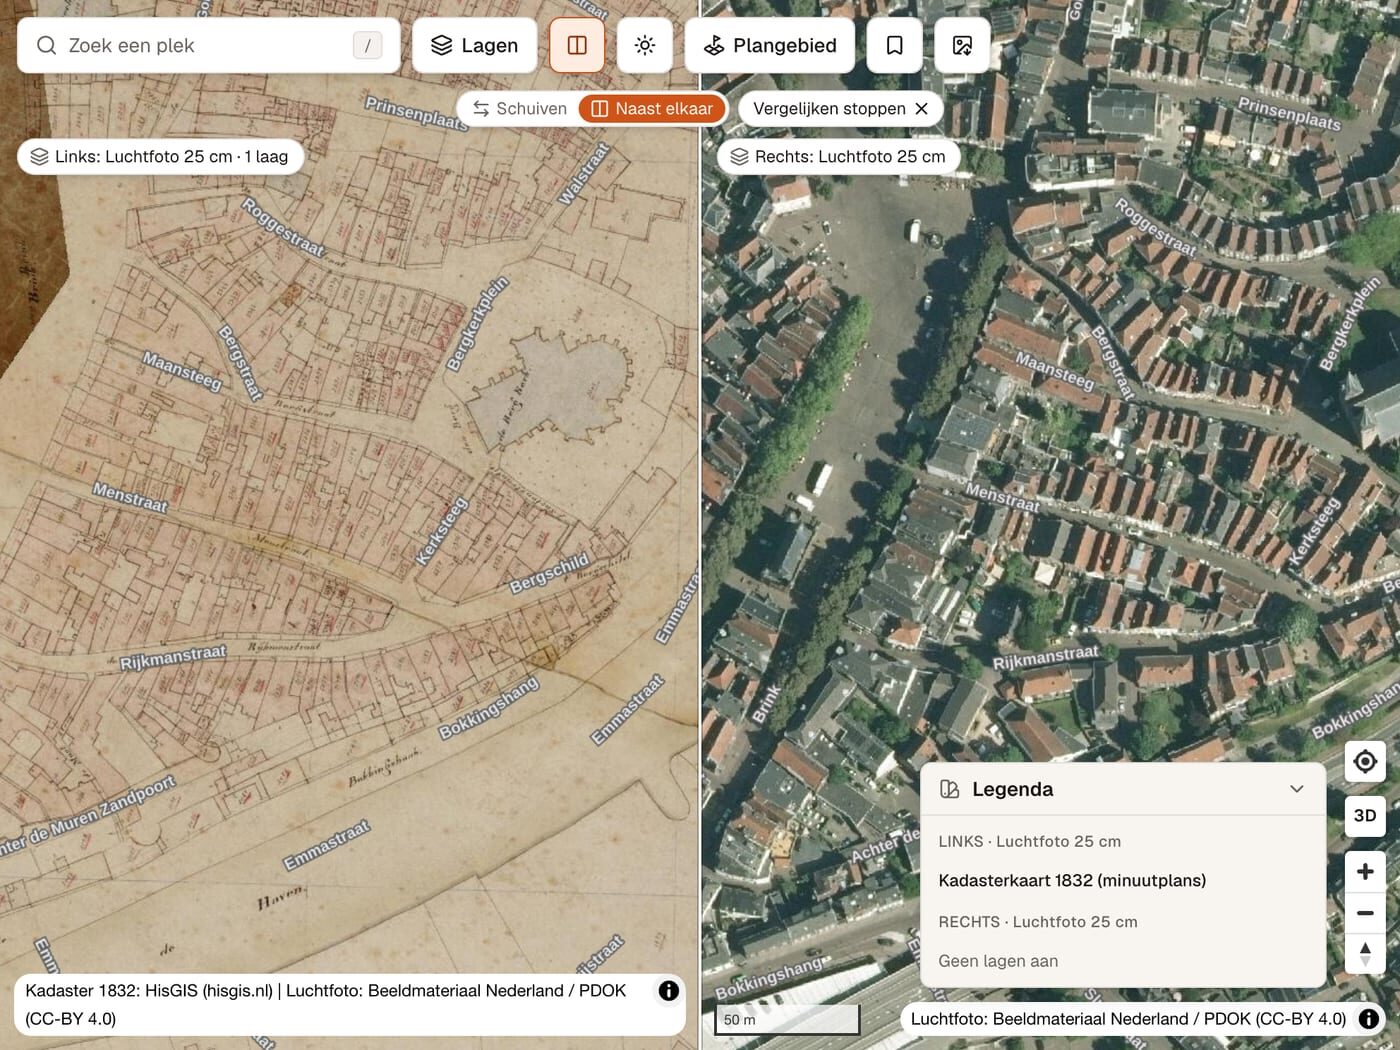
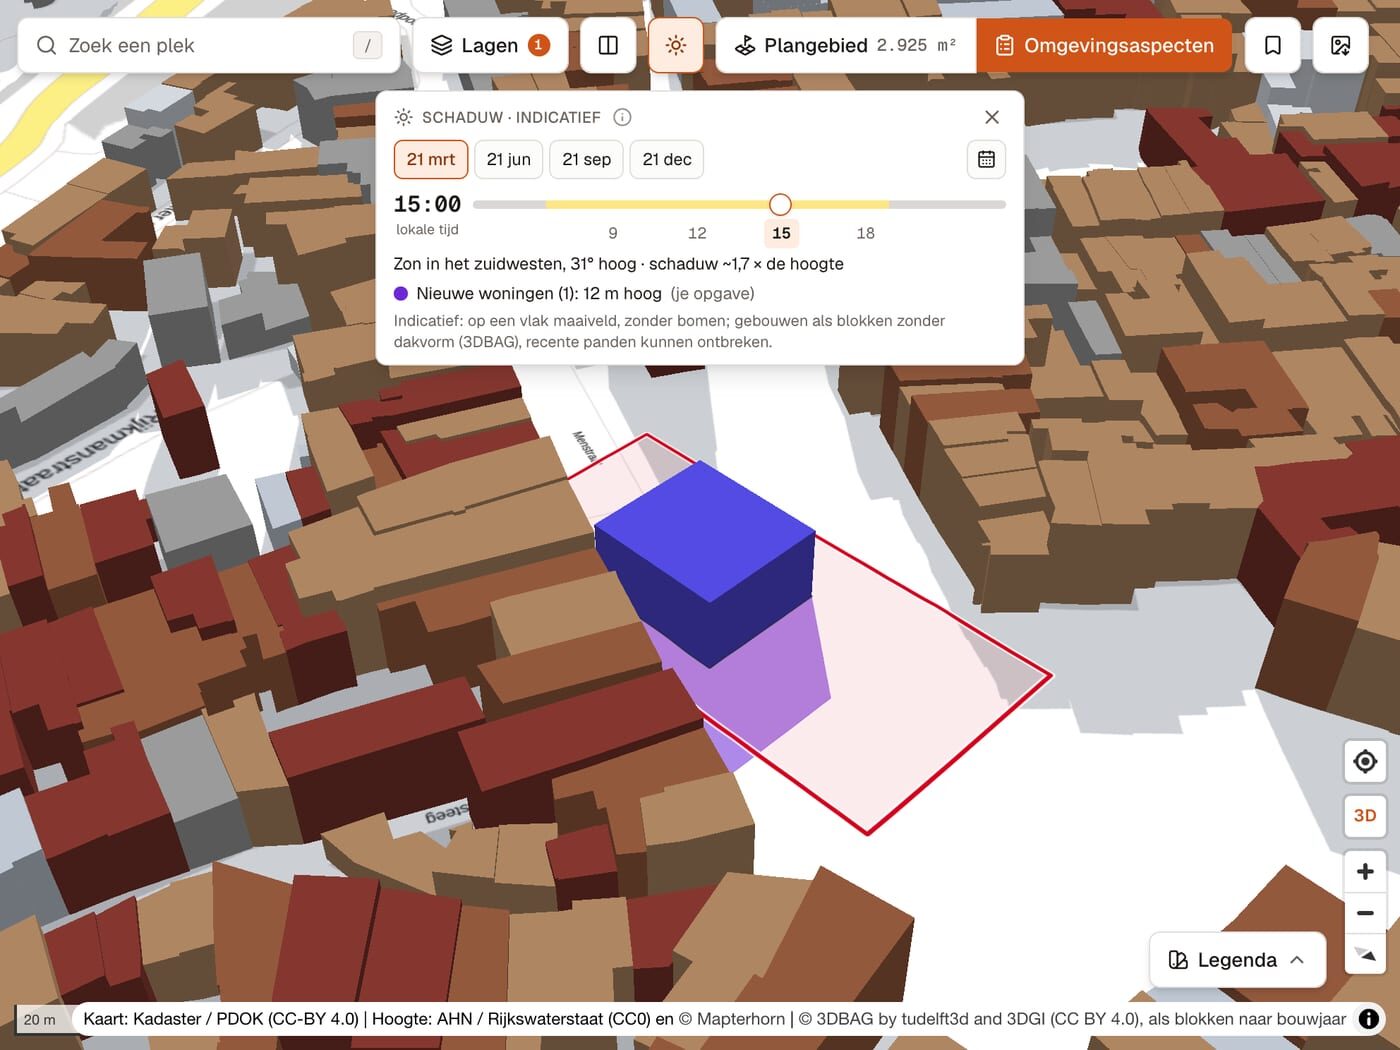
The cadastral map of 1832 next to today’s aerial photo, and a new home with its shadow on 21 March at 15:00 (indicative).
Behind questions like these are features you’d otherwise have to dig out of menus:
- a quickscan of a spot that asks 23 sources in one click, also as a PDF
- the environmental factors (omgevingsaspecten) of a plan area per theme, with distances to roads, rail, nature and monuments
- the Omgevingsloket’s permit check, next to the map
- buildings in 3D at their measured height, and aerial photos for nearly every year since 2016
- an export of your plan area plus 100 m around it, as DXF for CAD or as GeoJSON
Only facts from the tools
For this kind of work a confident wrong answer is worse than no answer, because someone might copy it into a permit application. So the main rule in the instructions is that facts about a place only come from tools: coordinates, parcel numbers, areas, protected areas, heights, building years. Every fact gets its source. We don’t show who owns a parcel (that’s paid Kadaster data), and the assistant doesn’t say what is or isn’t allowed. That’s for the municipality to decide.
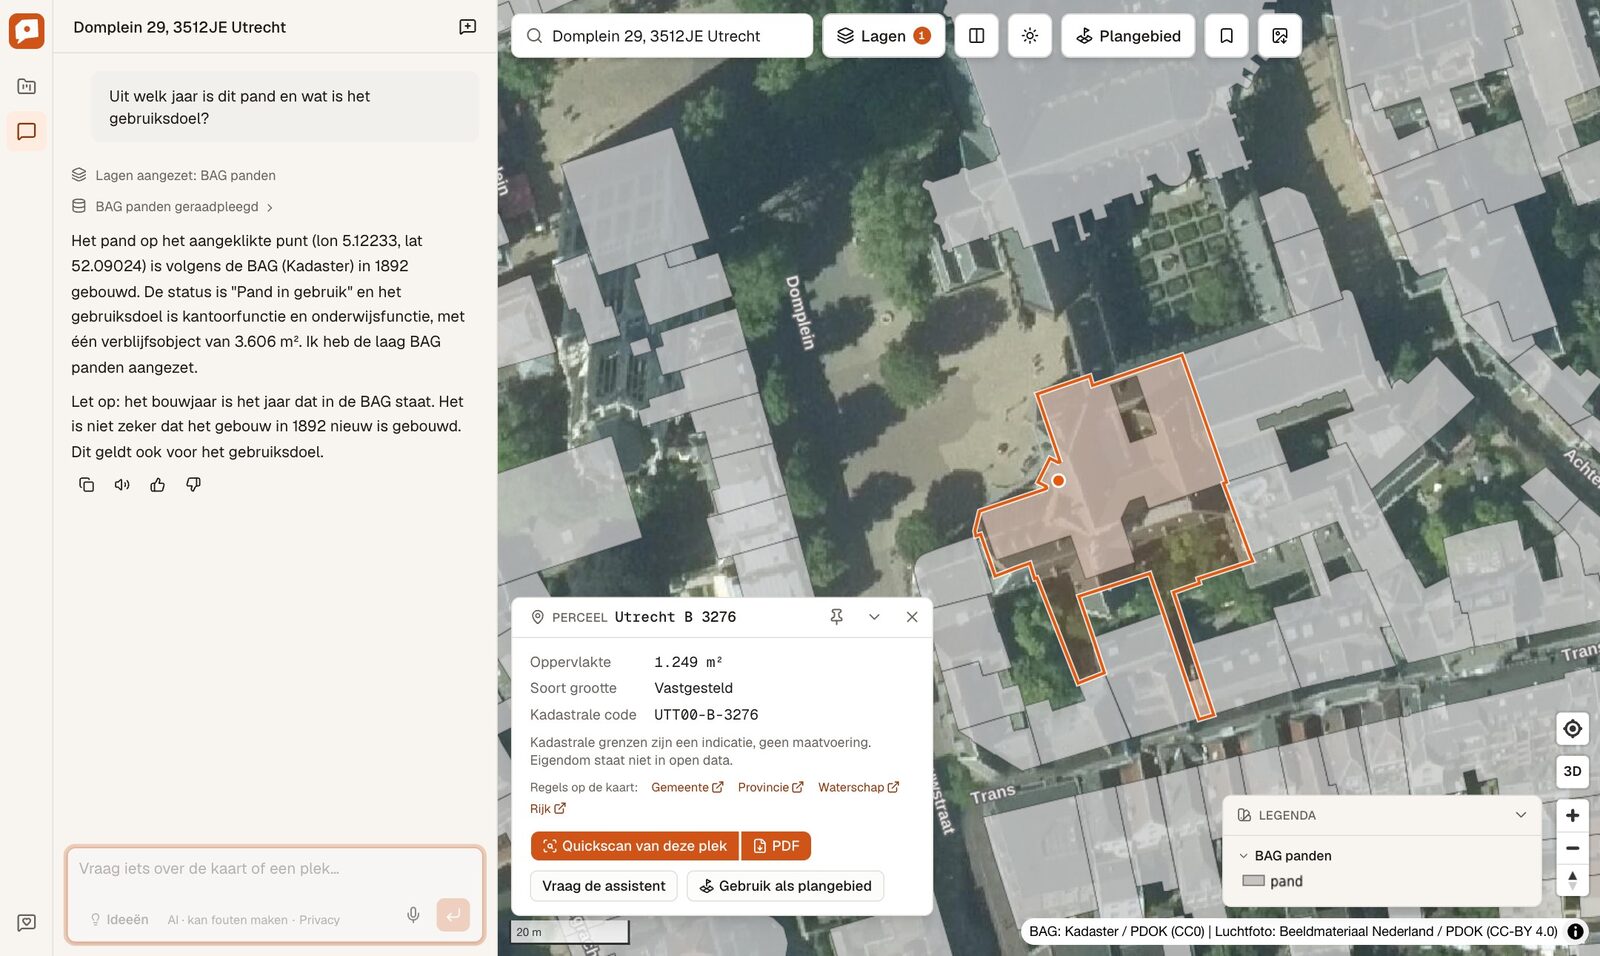
Ask when this building on the Domplein in Utrecht was built and it answers from the BAG (1892, in use as an office and for education). It also adds that this is the year the BAG has, which doesn’t prove the building is actually from 1892.
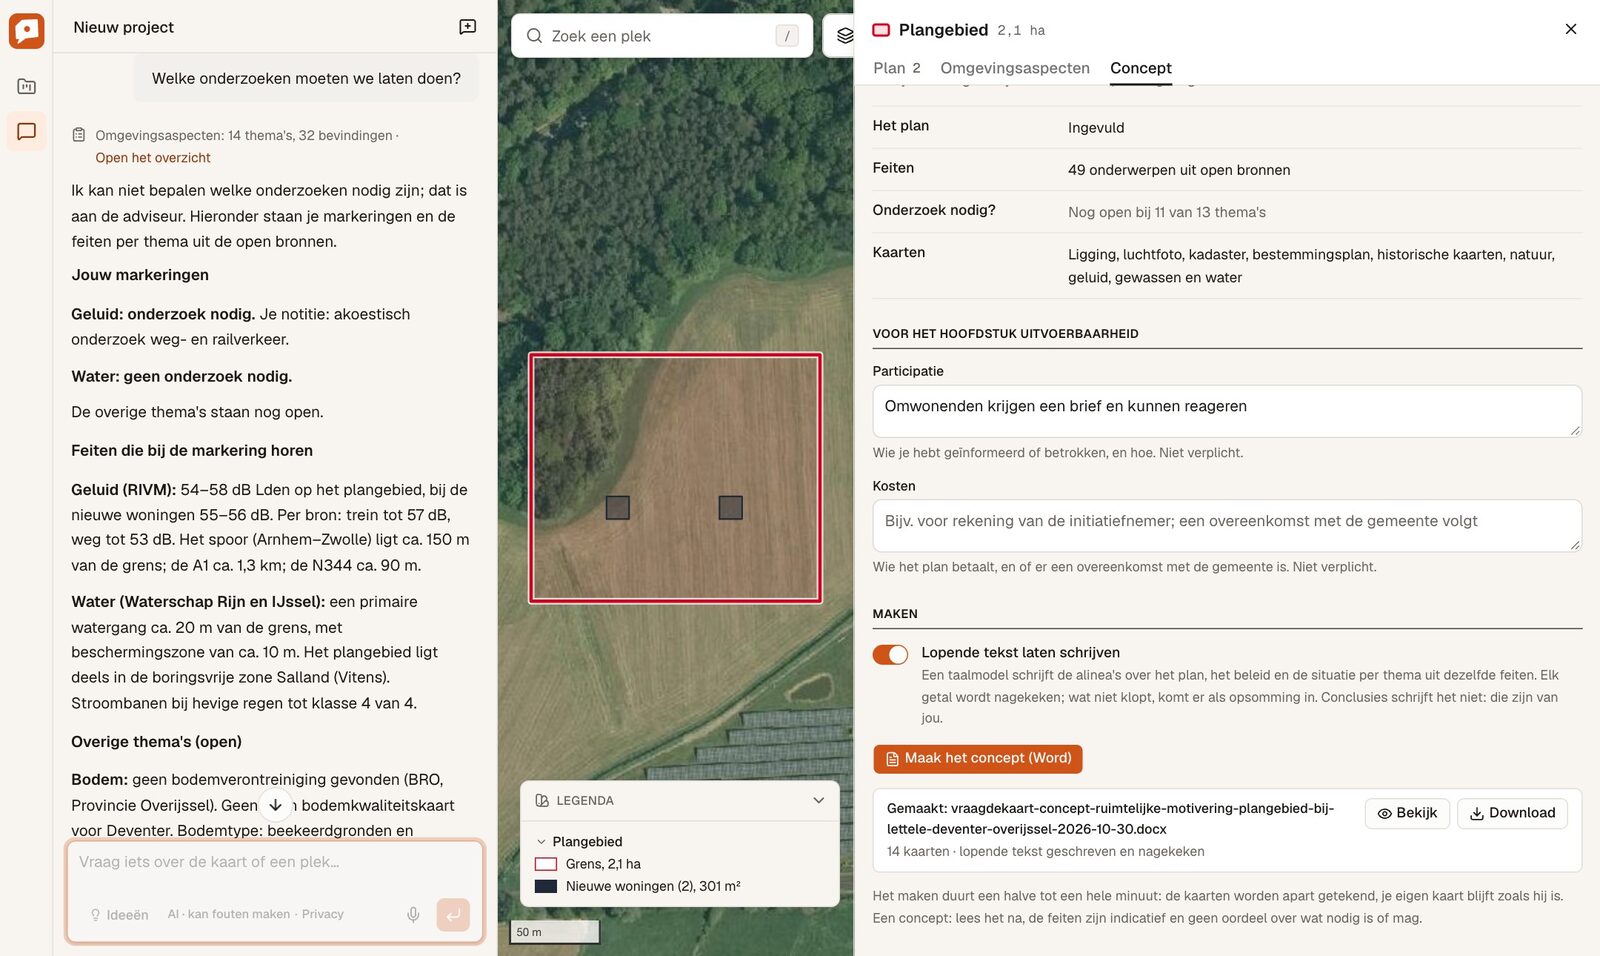
It does the same when a question isn’t the assistant’s to answer. Asked which studies we should commission for a plan area, it said that’s up to the consultant. Then it listed the choices already made per theme (noise: acoustic study needed, water: no study needed) with the facts behind each.
For the zoning plan it reads the plan’s own text at that spot and quotes the article, with its paragraph number:
A screen recording on a parcel near Zwolle, with Dutch voice-over and subtitles.
A first draft in Word
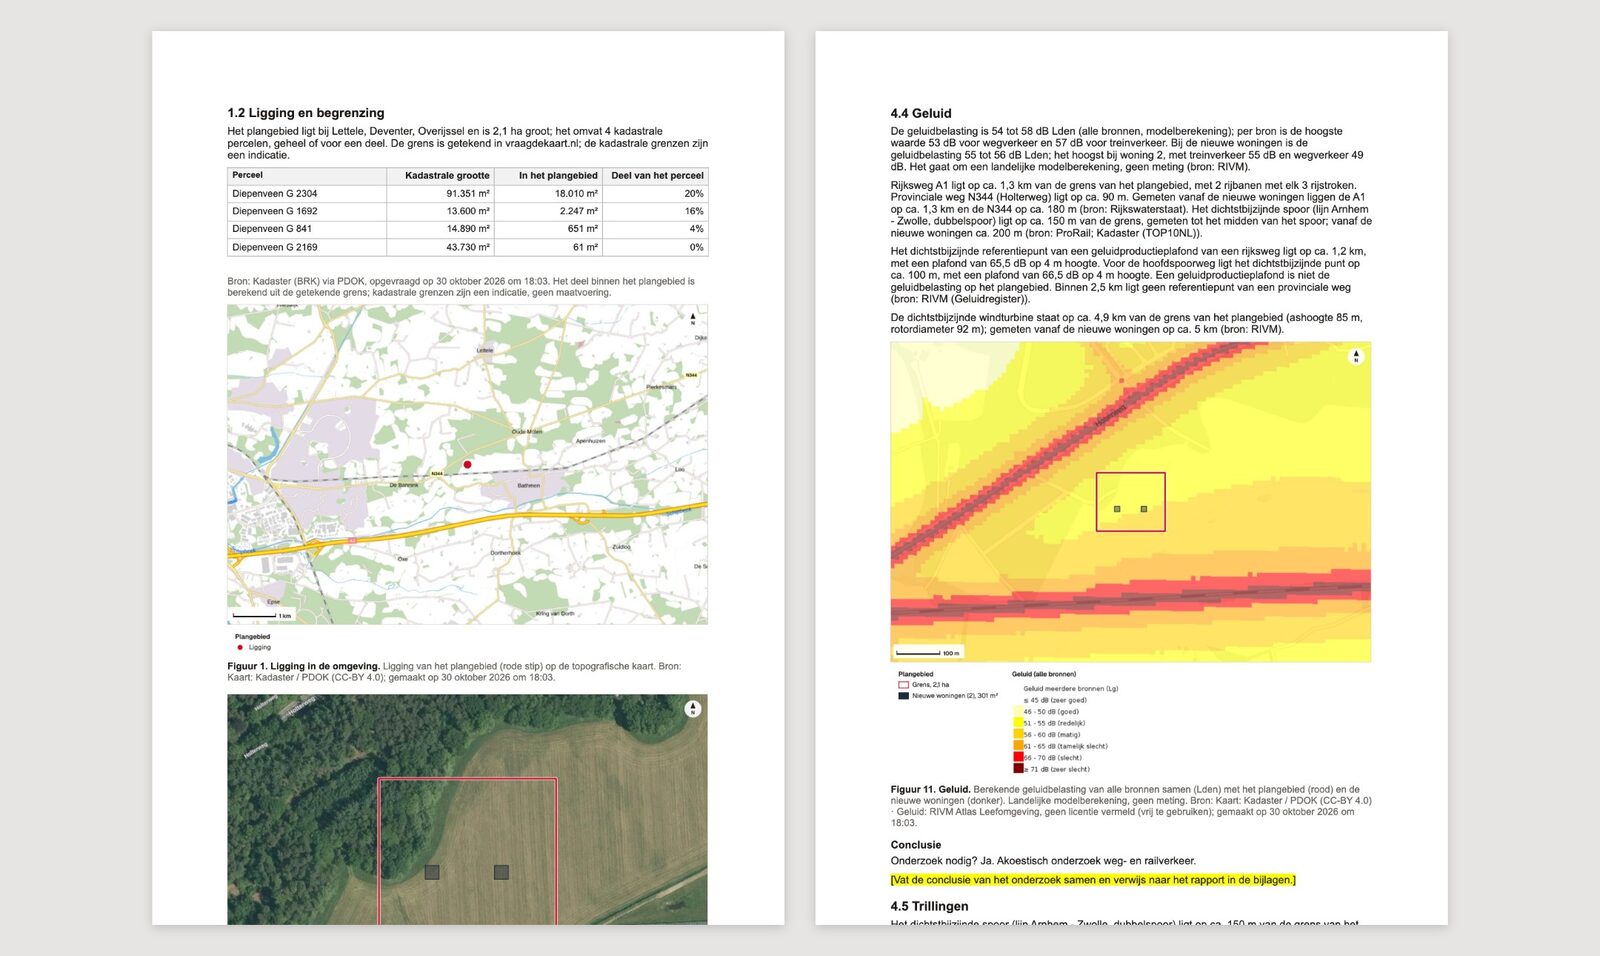
For a permit to build outside the zoning plan (a BOPA), you need a ruimtelijke motivering, a document that explains why the plan fits its location. Vraag de kaart makes a first draft in Word from the facts of your plan area, with the maps and an appendix of sources.
A language model writes the running text per theme, and it only gets the facts for that theme. We then check every number it wrote against those facts, plus a list of words it isn’t allowed to use. A section that fails the check goes in as a plain list of facts. The conclusions it doesn’t write at all. Those stay as yellow placeholders in the document for the planner to fill in.
The MCP server
You don’t have to use our chat. You can also connect your own assistant, like Claude, to the MCP server at https://vraagdekaart.nl/api/mcp. You log in with OAuth using your Vraag de kaart account, and the assistant runs on your own subscription.
In Claude Code:
claude mcp add --transport http --scope user vraag-de-kaart https://vraagdekaart.nl/api/mcp
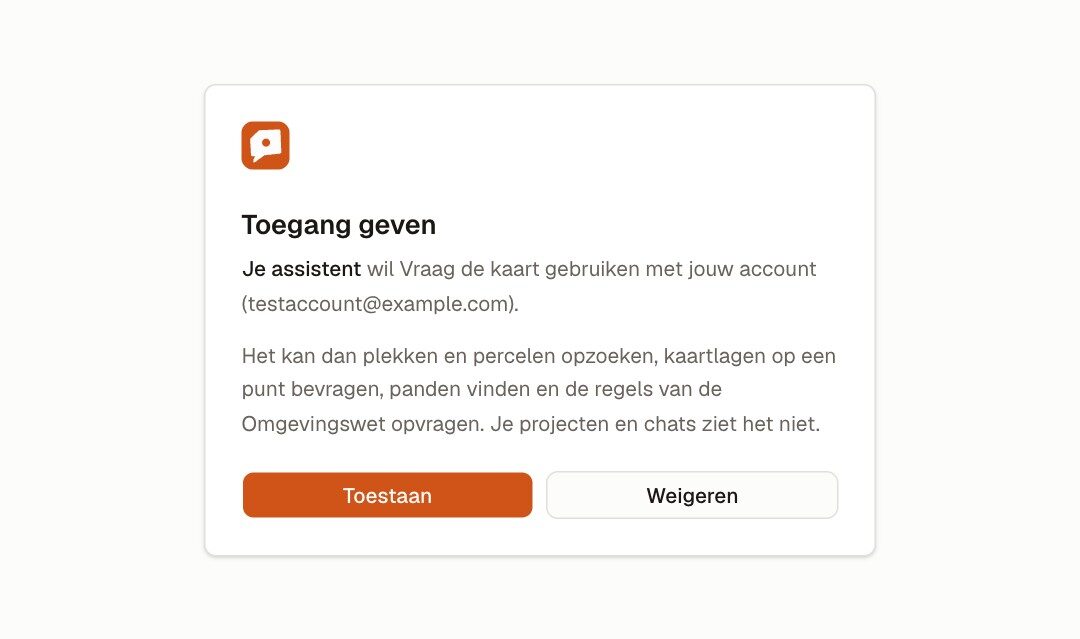
Then run /mcp, choose Authenticate and click Toestaan. In claude.ai or Claude Desktop you add it under Settings → Connectors → Add custom connector, with the same address. Either way you first get our consent screen, which also says the assistant can’t see your projects or chats:
There are two sets of tools.
Without a map
Nine tools for facts: search_location, get_parcel, query_layers, find_buildings, rules_at_location, plan_text, quickscan_pdf, list_layers and permits_nearby. Every call runs on a fresh headless map on the server, with the same code our chat and our tests use. Answers come with their source and caveats, and the server’s instructions tell the assistant to pass those on. Something like “Zoek Brink 1 in Deventer: ligt het in Natura 2000 of het NNN, en is het een monument?” works well.
On the map you have open
Open a project in Vraag de kaart and click the plug icon above the map (Koppel aan je assistent).
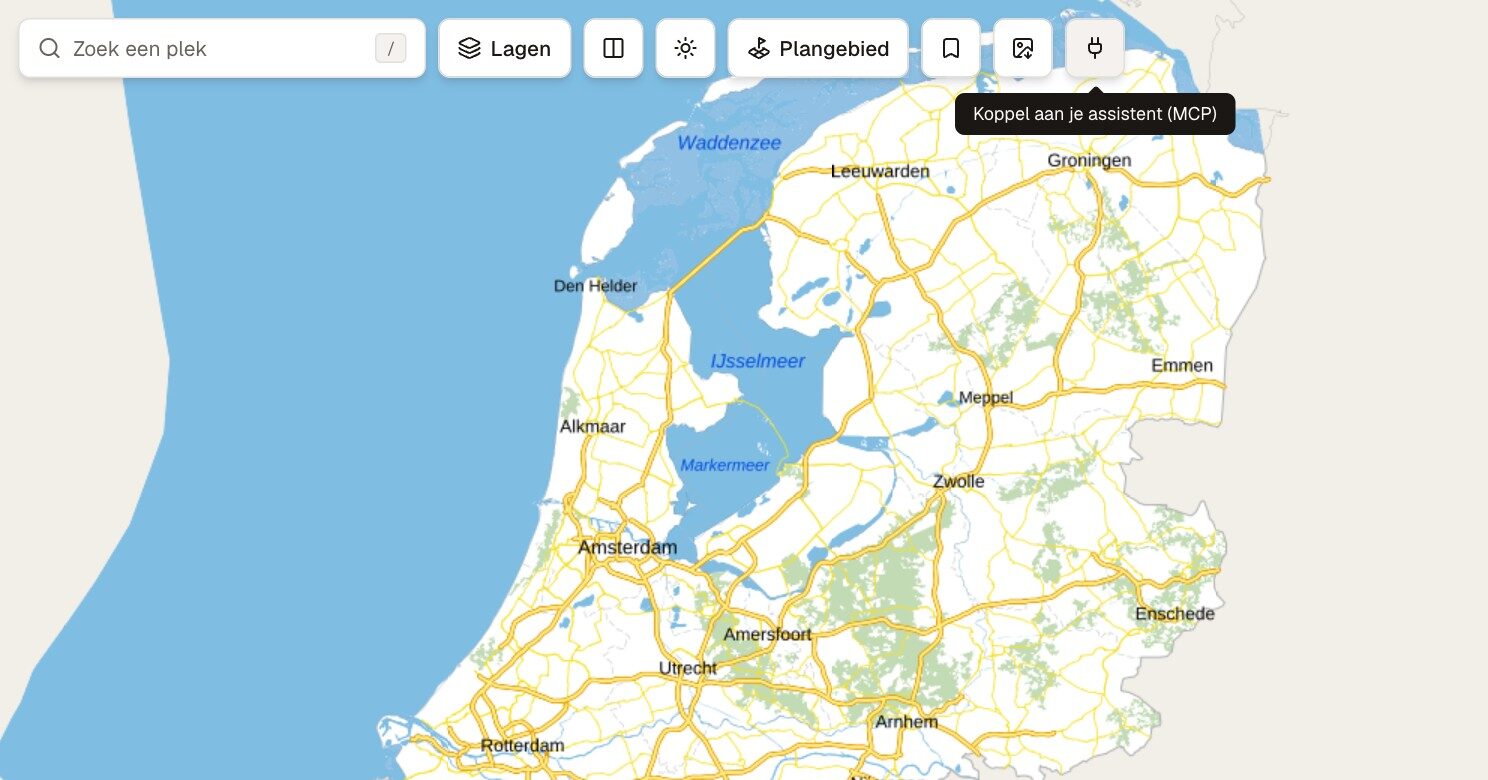
From then on your assistant can use 29 map_* tools on that tab. It can search and fly, switch base maps and layers (historic maps and aerial photos per year too), compare maps, draw, mark buildings, make a plan area from parcels and show shadows. It can also download the quickscan PDF, a map image, the Word draft or the DXF, and those land in your own browser.
Asked to show the buildings in Utrecht from before 1700, it marked 378 of them:
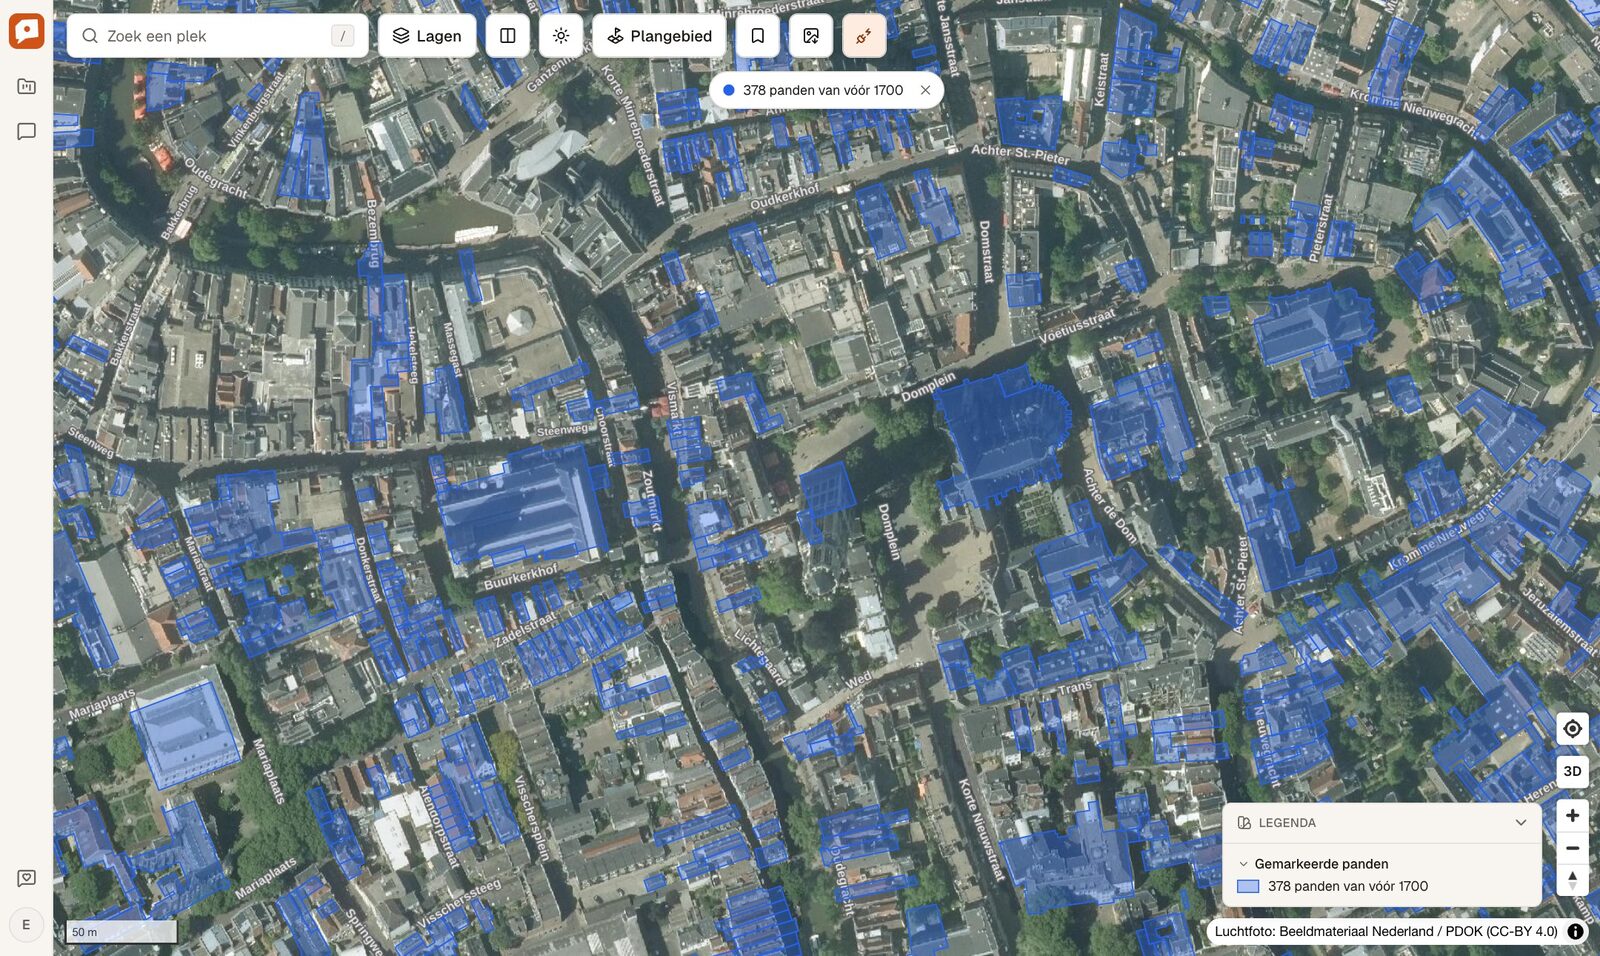
map_view sends the map back to the assistant as an image, legend included, so it can look at the result instead of only reading the tool output.
The link itself is a simple relay. The linked tab long-polls our server for its next command, claims it so no other poll runs it twice, runs it on the real map and posts the result back. The assistant gets the same output our own chat would.
The MCP server has no owner data and no energy labels (the EP-Online terms forbid passing those on in bulk), and there’s a daily limit per account.
Testing against the real model
Every change to the instructions, the tools or the model gets run against 225 behaviour specs. A spec asks the real model a question, with the real tools on a headless map, and then checks the outcome: which tools it called, what the map shows and what the answer says. Every example prompt in the chat has a spec, and so does every question in the demo films. When the model gets something wrong, we first write a spec that fails and only then change the instructions or the tool description.
There are also headless Chrome scripts that click through the real UI at desktop and phone width and save screenshots along the way. Most screenshots in this post were made like that.
Feedback goes through the chat too. There’s a thumbs up and down under every answer, and if you tell the assistant something is wrong, it checks the source again and offers to send your remark to us. It only goes out after you click Versturen, using the AI SDK’s tool approval.
Try it
Vraag de kaart is in a closed beta and free while the beta runs. You can log in with Google or sign up. On vraagdekaart.nl/video there’s a demo film of almost four minutes and a short one per profession, all real screen recordings. And if you’re building an agent yourself, vraagdekaart.nl/llms.txt describes the app and the MCP server for other assistants.
Feedback much appreciated: [email protected], or just try it at vraagdekaart.nl.
Header: Amsterdam around 1900 and today, side by side in Vraag de kaart. Topographic map: Kadaster (Topotijdreis). Aerial photo: Beeldmateriaal Nederland / PDOK (CC-BY 4.0).